
INTRODUCTION
Most beginners treat their side hustle like a game of luck. They post content, pray for traffic, and hope for sales. But in the modern digital landscape, and AI Revolution. Hope is not a strategy. The real ‘Synergy’ happens when you stop guessing and start using Data Analytics.
Data is simply the footprints your audience leaves behind. Whether it’s a weather report from a custom app (as seen in our dashboard above) or the click-through rate on a Pinterest pin, every data point tells a story. In this guide, we’ll demystify analytics and show you how to turn raw numbers into a roadmap for consistent, long-term profit.”
Sustainable growth emerges when you transition from intuition-driven decisions to a data analytics–led operating model.
This guide is designed to operationalize that insight. Instead of reacting to outcomes, you’ll learn how to interpret leading indicators, identify performance drivers, and systematically convert raw data into a scalable decision framework—one that compounds into consistent, long-term revenue generation.
To build a massive income through data analytics in 2026, focus on mastering SQL, Python, and AI-driven visualization tools. This essential blueprint involves turning raw data into actionable business intelligence, a high-demand skill for modern corporations.
Why Data Is The “Engine” of Your Business
Think of your side hustle as a car. Content is the fuel, but data analytics is the dashboard that tells you how fast you’re going and when you’re running out of gas. Without analytics, you’re driving blind. By tracking key metrics, you can identify which topics your audience loves, which products they are actually buying, and where you are wasting your time.
without analytics, you are operating in a zero-visibility environment, no speedometer, no fuel gauge, no diagnostics. You might be moving, but you have no control over direction, efficiency, or sustainability.
When you start tracking key metrics, the entire dynamic shifts. You gain visibility into:
- Audience preference signals (which topics generate engagement and retention)
- Conversion pathways (which products or offers actually monetize)
- Resource allocation leaks (where time and effort are being underutilized)
This is where real leverage exists. Data doesn’t just inform—it enables decision precision. You stop producing content blindly and start engineering outcomes based on evidence.
In practical terms, analytics transforms your workflow from:
- Guesswork → Measurable strategy
- Activity → Performance optimization
- Effort → ROI-driven execution
That’s the difference between a side hustle that drifts—and one that scales with intent.
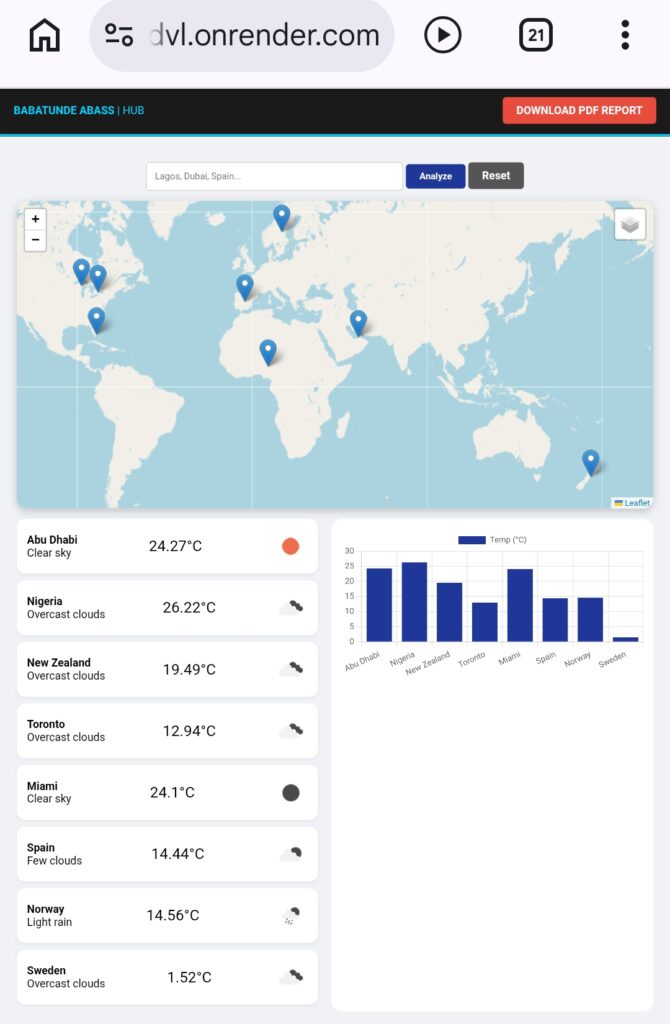
Weather forecast app. showing A forecast for different cities and Continents with Data Table and Graphic representation for Visual View.
Transforming Raw Data Into Intelligence
From Numbers To Knowledge: The Arts of Weather Intelligence
To understand the true value of data, one must look at how it is structured and presented. In my Weather Intelligence Report (shown above), we aren’t just looking at random numbers. We are taking raw environmental variables—temperature, location, and atmospheric conditions—and organizing them into a format that allows for instant comparison however,
This is the core of Data Analytics. It’s the process of turning ‘noisy’ information into ‘quiet’ intelligence. For a digital entrepreneur, this might look like a weather report, but the logic is the same for your business:
- Descriptive Analytics( Interpreting Signal): What happened? (e.g., ‘Abu Dhabi has a clear sky at 24.27°C.’)
- Diagnostic Analytics (Anticipating Trends): Why did it happen? (e.g., ‘Why are sales higher in Spain today? Is it related to the weather or a specific marketing campaign?’)
- Predictive Analytics( Executing with Probabilistic confidence): What might happen? (e.g., ‘Based on current trends, should we promote outdoor gear in Nigeria?’)
By using professional reporting tools—like the one I built for this weather intelligence project—you move from being a ‘guesser’ to a ‘strategist.’ You stop wondering if your side hustle will work and start knowing why it works.”
At that point, your side hustle is no longer an experiment. It becomes a managed system with feedback loops, where every action is informed, measured, and iteratively optimized.
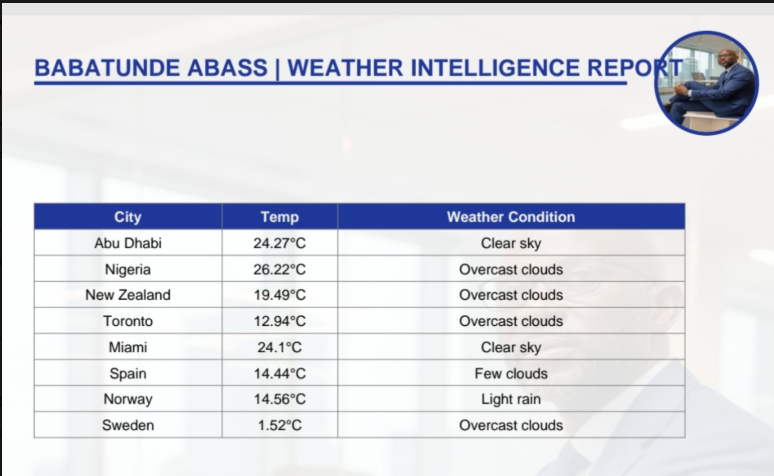
A Professional Data Visualization Report Demonstrating The Clarity That Structured Analytics Bring To Complex Info
The 3 Metrics Every Side Hustler Must master
The “Big Three” of Side Hustle Analytics
While my weather report focuses on temperature and sky conditions, your digital business has its own ‘weather’ patterns. To reach long-term success on Piscartsynergy, you must track these three essential metrics:
- Click-Through Rate (CTR): This is the percentage of people who see your link and actually click it. It’s the ‘temperature’ of your headlines. If your CTR is low, your ‘sky’ is overcast—you need to brighten your titles to get noticed. What it Reveals: Relevance, Curiosity gap, and Positioning Strength. Failure Mode: High impressions + low CTR = weak hook or misaligned targeting. Optimization Lever: Headline Engineering,Thumbnail/Visual Alignment, Keyword intent matching’
- Conversion Rate: This tells you how many visitors actually took action (bought a product or joined a newsletter). High traffic with no conversions is like a clear sky with no sun—it looks good, but it’s not providing the energy (income) your business needs. What it Reveals: Offer strength, trust architecture, and funnel Coherence. Failure Mode: High traffic + low conversion = broken value proposition or friction in the funnel. Optimization Lever: Offer clarity, CTA Placement, landing page structure, social proof. If CTR gets users in the door, conversion rate determines whether the visit resulted into income
- Bounce Rate: This measures how quickly people leave your site. A high bounce rate means your content isn’t answering their questions fast enough.” What it Reveals: It shows Content resonance, Load speed, and Expectation Alignment. Failure Mode: High bounce equivalent to mismatch between headline and Content. Optimization Lever: Above Content Structuring, internal linking, Page speed
Visualizing Value: Why Beautiful Data Wins
Raw data, like the temperatures in my Global Weather Intelligence Snapshot, can be overwhelming when left in a simple spreadsheet. The true magic of analytics happens during the Visualization phase. As you can see in the infographic above, we have transformed a list of temperatures into a ‘story’ of extremes.
In business, visualization is your most powerful communication tool. Whether you are showing a potential partner your growth or checking your own Pinterest stats, a clear visual allows you to see:
- Outliers (Abnormality Detection): Like Sweden’s 1.52°C, you can instantly spot what isn’t working in your business. When Sweden drops to 1.52°C, it becomes immediately visible as a deviation from the baseline. How Does it Related to your business. It shows Failing Content, low converting Products, and Underperforming Content.
- Trends( Pattern Recognition): Notice the ‘50% Overcast Prevalence.’ In a side hustle, this helps you identify a ‘saturation point’ in your market. This not just shows a Statistics but reveals a recurring condition that common.
- Winners (Performance Benchmark): Nigeria’s peak temperature stands out instantly because visualization amplifies contrast. In your content strategy, this is your ‘Viral /High performance post’ that you need to replicate.
At Piscartsynergy, we don’t just collect data; we refine it until the ‘Peak Temperatures’ of your business are impossible to ignore.”
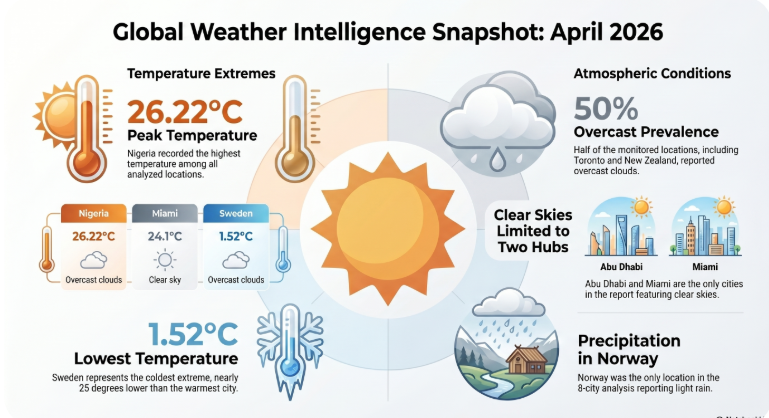
Turning Raw Data Into A Visual Narrative: A Snapshot of Global Weather Intelligence Developed To Highlight Extremes and Patterns
Using Analytics To Power Your “Income Engine”
Monetizing Insights: How Data Drives Dollars
This is where the ‘Synergy’ becomes profitable. Once you understand your analytics, you can apply for high-paying Pay-Per-Click (PPC) affiliate platforms like Impact or ShareASale. These platforms look for entrepreneurs who understand their ‘Atmospheric Conditions.’
When you can prove to a brand that you know exactly which cities are clicking your links and why, you move from a basic affiliate to a Premium Partner.
Data allows you to negotiate higher commissions because you aren’t just sending traffic—you are sending ‘Intelligent Traffic.’ By mastering these analytics today, you are building the engine that will power your financial freedom tomorrow.”
By using this our Weather analytic ideas into your Content Business, you are not just building Trust but also operating as a Data-backed distribution partner.
Remember, PPC platforms don’t reward volume alone; they prioritize predictability and conversion quality. What they’re really assessing is your ability to control and optimize “traffic conditions.” Especially When you can demonstrate:
Funnel efficiency metrics (CTR → conversion continuity)
Geo-level performance (which regions generate the highest EPC—earnings per click)
Audience intent mapping (why specific segments convert)
You’re no longer an affiliate sending undifferentiated clicks. You become a performance asset.
Conclusion: The Future of Data-Driven Synergy
Your Roadmap to Intelligent Growth
Data analytics is no longer a luxury reserved for tech giants; it is the fundamental survival kit for the modern side hustler. As we have seen through our Global Weather Intelligence models, the ability to collect, structure, and visualize information is what separates a ‘hobbyist’ from a ‘business owner.’ Meanwhile,
At Piscartsynergy, we believe that your digital journey should be fueled by creativity but guided by data. By implementing the ‘Big Three’ metrics—Click-Through Rate, Conversion, and Bounce Rate—you are building a business that is resilient, transparent, and highly profitable. Don’t be intimidated by the numbers. Embrace them as the footprints that lead to your future success. The engine is ready; it’s time to start driving with clarity.”
The operating philosophy is straightforward: creativity drives acquisition, but data governs direction. When you instrument your workflow around the Big Three metrics—Click-Through Rate (CTR), Conversion Rate, and Bounce Rate—you’re not just tracking performance; you’re building a transparent, feedback-driven system that can be optimized continuously.
Frequently Asked Questions(FAQ)
Frequently Asked Questions About Beginner Analytics
1. Do I need to be a maths expert to understand analytics?
Absolutely not. Modern tools like Google Analytics and Pinterest Insights do the ‘math’ for you. Your job is simply to look for patterns—the ‘highs’ and ‘lows’—to understand what your audience enjoys.
2. How often should I check my business data?
In the first 30 days, focus on *Engagement*. Are people staying on your page? If they are reading your 1,500-word articles to the end, Google will notice and start sending you more traffic naturally
3. What is the most important metric for a new blog?
In the last 30 days, focus on Engagement. Are people staying on your page? If they are reading your 1,500-word articles to the end, Google will notice and start sending you more traffic naturally.

“AI enthusiast and Digital entrepreneur dedicated to helping others Leverage Technology for Financial Freedom”.
As an Amazon Associate, I earn from qualifying purchases.
`
At where can I source for Digitall AI materials from the site.
looking forward to your directive.
Thanks
Taofeek Usman
Thanks for Your Request, you can check for it on any of our short Orange color link on any of our articles.
thanks